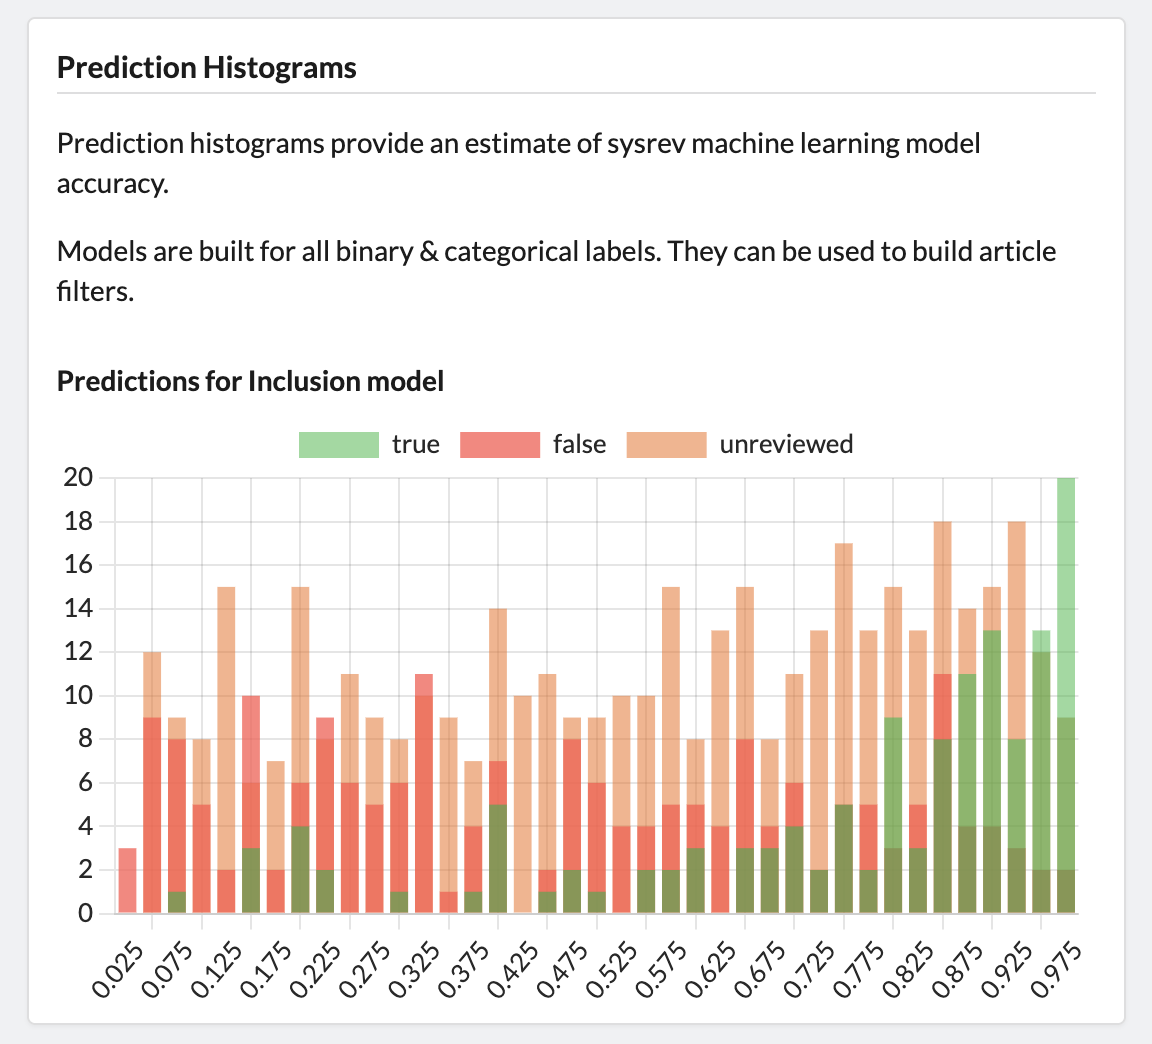
The prediction histogram
Once the prediction model has run, it will generate a prediction histogram which will be visible on the Overview page of your project. The histogram provides a snapshot of the model's predictions for the default Inclusion label. The histogram shows on the x-axis the model's prediction of how likely an article is to be included and a view of how many articles for each prediction value have been assigned include (true) or exclude (false) by human reviewers, and how many remain unreviewed.